Debugging Drupal with XDebug, Acquia Dev Desktop and PHP Storm
If you want to be able to debug your PHP code like some kind of software professional from the Java world, then this tutorial is for you.
Tools
- XDebug is an extension for PHP which allows an IDE with the right tools to pause and step through PHP code as it runs allowing you to inspect the values of variables as they are set
- Acquia Dev Dekstop is an AMP stack from Acquia
- PHP Storm is a nice IDE for writing PHP code in
Add XDebug to Acquia Dev Desktop PHP ini
- Open Acquia dev desktop control panel
- Go to settings -> Config
- Click edit next to your PHP ini config
- Uncomment the line which says: zend_extension="/Applications/Dev Desktop/php5_3/ext/xdebug.so"
- Add the following to the end of the file, save the file and restart apache and mysql ...
[debug]
xdebug.remote_autostart=off
xdebug.remote_enable=1
xdebug.remote_handler=dbgp
xdebug.remote_mode=req
xdebug.remote_host=localhost
xdebug.remote_port=9000
Add PHPStorm bookmarklets to your browser
- Goto the following URL http://www.jetbrains.com/phpstorm/marklets/
- Click Generate on the XDebug panel
- Drag the Start Debugger and Stop Debugger links to your browser bookmark toolbar
Try it out
- Open PHP Storm and open a local project
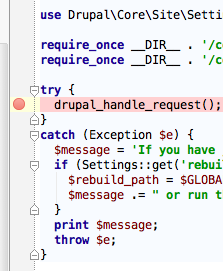
- Open index.php and set a breakpoint (click in the space between a line number and line of code)
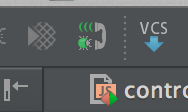
- Press the telephone button in the PHP Storm toolbar to make PHP Storm listen for PHP debug connections.
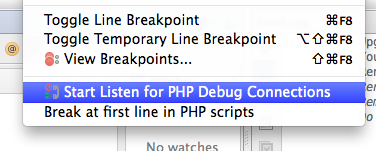
If you can't see this then choose Run > Start Listen for DebugConnections instead:
- Goto the site in the browser
- Click the "Start Debugger" bookmarklet and reload the page
- PHP Storm should popup and ask your permission then you can start using the debugger
Its still not working
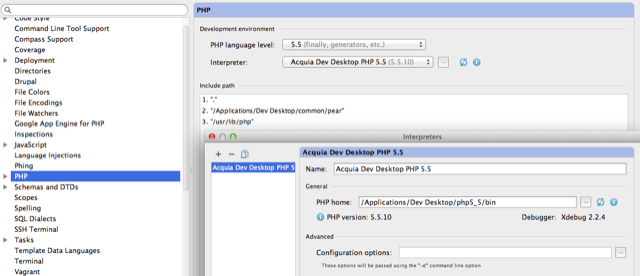
I didn't have to do this but others have reported the need to go to to PHPStorm > Preferences > PHP and add an entry for a "PHP interpreter" pointing over to /Applications/Dev Desktop/php5_5/bin (changing php5_5 for the version you might be using).
The PHP Storm debugger in detail
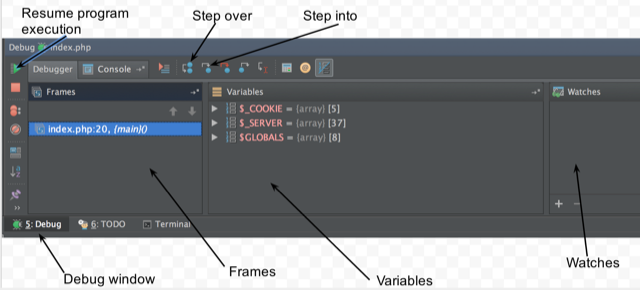
In the debugger pane which opens in PHP Storm you will see three panels.
- Frames shows you the stack listing the files and functions which you are currently in
- Variables lists the variables which are currently in scope. You can click on them to expore them and discover their present values
- Watches lets you set watches on variables - drag one from the variables list into the watches list and you can see how its value changes over time. In the top of the debugger window are several buttons. The main two are:
- Step over which moves execution of the program along by one line in the present file. This will execute all functions in that line and what ever lies beneath them
- Step into will go into the function being called on the line and move execution to the first line of that function.
Step over lets you quickly step over every line of a specific function, step into lets you follow every action of the code where ever it leads.
If you spend too long enjoying yourself in the debugger, your web server will eventually think execution has stalled and send a 500 back to the web browser which made the page request.
The green Resume program execution button lets you skip to the next breakpoint. If there are no more breakpoints set in the code it will run to the end.
In Summary
Debugging step by step is an invaluable tool for any software developers.
It has been difficult to setup in the past but the modern tools described here make it very simple and well worth any initial effort in learning to use it.
Let me know how you get on in the comments below.