It canna handle the load cap'in
Load testing
When building a site you want to make sure that it can handle the expected (and even unexpected) load that might incur through the traffic that the site will receive.
There are some tools that you can use, such as ‘siege’ or 'ab' (Apache Benchmark) to test the impact of multiple users requesting a page (or several pages). These can be good for the initial testing of page loads etc., but in order to be able to see more realistic results of multiple users from multiple locations around the world there is a nice online service called Load Impact.
This allows you to configure user scenarios (user journeys through a site) and store your test configurations (configurations that you can run multiple times and clone to store different variations) and even schedule tests to be run on you site at regular intervals.
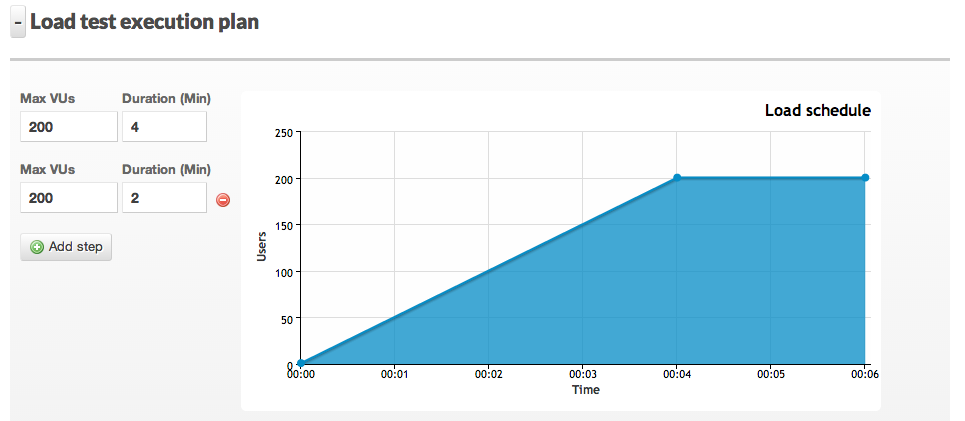
The configuration allows you to set how many users you want to simulate accessing your site over a period of time, known as a 'load test'. So, for example, you can scale from 1 to 200 number of users over a five minute period.
You can also add multiple user schedules within the load test, meaning that you can build a scenario which increases the number of users from 1 to 200 over a four minute period, then keep the number of users at 200 for a further two minutes.

You can also configure where your traffic is going to be coming from in the world and set up multiple sources.
Site testing
This approach became invaluable recently when working on a site. The site had varnish cache configured for it, but there were a couple of places where AJAX calls were being made back to the Drupal site to get up-to-the-minute data from a third party web service.
From the initial testing with Load Impact on the home page, our varnish cached pages responded as you would have expected - no problems at all. We then also used Load Impact to test a specific AJAX end point to see how this would handle the requests.
Having done this, this highlighted that the third party web service response gradually got slower as the number of users increased, indicating a potential weak point in the site.
After the initial testing of specific pages, we did full testing of a users journey. We used Load Impact as it has a nice plugin for Chrome which allows you to record page clicks into its programming language script (Lua) which you can save as a user scenario. They also have full documentation on their scenario scripting.
We then ran this test using the above load plan (1 - 200 users in four minutes, followed by continuous 200 users for a further two minutes) and found that once we had got up to about 200 users using the site, the site became very slow and finally ground to a halt. Not a good outcome.
Investigating highlighted problems
Within Apache’s configuration for its log format, you can include the 'the time taken to serve the request, in seconds' (%T) and 'the time taken to serve the request, in microseconds' (%D) in the access log. The reason for including both is because the first (%T) is in seconds and you would hope that most requests take less than a second to process.
So including the second time (%D) which is in microseconds, you can get a more accurate response time. Also, having the first time in seconds can help when grepping the logs for requests (which took over a second to process).
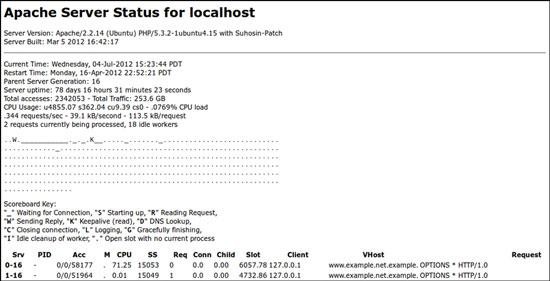
You can also enable Apache’s ’status’ screen, but for security reasons, make sure that this is configured to be behind a htpassword or only accessible via localhost and an SSH tunnel. This status page shows various details about Apache including the number of threads that are being used and what requests the threads are being used for.

Having added the request times to the log format and activated that status page, we re-ran the test.
As the number of users approached 200 concurrent users, we could see the apache threads building up and not being released until we hit the maximum number of threads (255). At this point apache was then queuing requests, delaying all future requests.
Once the test had stopped we analysed the access logs which showed that the AJAX requests had been taking over 40 seconds to process as the number of users increased, which was therefore tying up a thread meaning that we eventually hit out limit.
As there was nothing that could be done about the speed of the third party web service, we opted for caching the response from their web service for a period of five minutes, reducing the number of requests to it, meaning that the service could then handle the requests better.
Having implemented the caching, we re-ran the tests. Throughout the test, the site was responsive and seemed to have no impact from the number of users on it.
We were much happier and the client was very pleased that their site would be able to handle the load that they might expect!